- Ivan Luminaria/
- Database Strategy/
- Technical Leadership & Projects/
- The restart fixed it. The problem is still there./
The restart fixed it. The problem is still there.

The restart fixed it. The problem is still there. #
Why an incident that closes without a reconstructed causal chain is not an isolated episode — and what the system still holds for anyone willing to look at it calmly.
Friday, 7:40 PM #
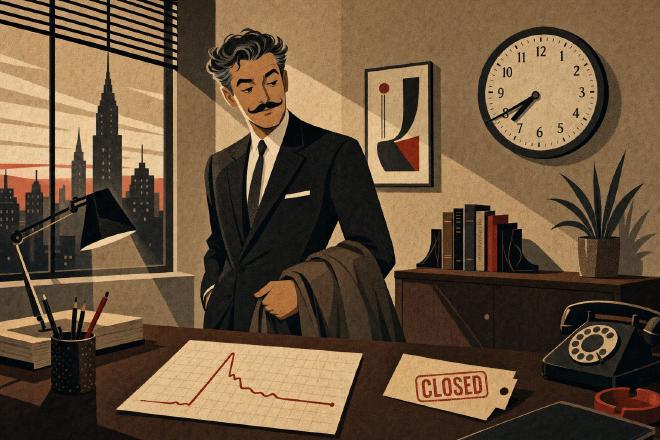
There’s a moment a CIO knows well, one that never shows up in reports. The incident started Thursday night at 02:17 — a slowdown on a critical service, latencies above threshold, a few sessions timing out, a handful of customers affected. The on-call team connected, watched for forty minutes, collected some traces, didn’t understand. At 03:11 the curve came back down. On its own. The team waited another thirty minutes to be safe, watched the system stabilize, and closed the bridge call. In the morning, the daily stand-up spent three minutes on it: “it resolved itself, let’s keep an eye on it.” By Friday afternoon, with three business meetings on the calendar, nobody mentioned it again.
At 7:40 PM the CIO leaves the office. The system is holding. The weekend begins. The incident enters — without anyone having consciously decided to put it there — the mental category of “one-off event.” It’s not a formal decision. It’s a decision by omission: nobody writes anything, nobody asks, the dedicated Slack thread stops getting messages, the post-mortem is never called. Monday morning the system is still holding. Tuesday too. By the end of the following week, in the operational debrief, the topic doesn’t even appear as a line item.
The moment the reconstruction window is lost is not the moment of the incident. It’s Friday evening. Not when it broke, but when people stopped looking.
What the system still holds, even if nobody went to check #
There’s a widespread belief, almost a professional truism, that goes: “once an incident resolves, without the logs from that moment, the root cause can’t be reconstructed.” It’s true in exactly one case — when no trace was preserved. In almost every other case, the system has more memory than the people operating it tend to assume, and the investigation window is much longer than the dynamics of urgency suggest.
On an Oracle database, AWR (Automatic Workload Repository) keeps snapshots every hour, with a default retention of eight days, configurable up to five weeks. Inside each snapshot: dominant wait events, execution plans for top queries, I/O statistics, active sessions, most-contended segments. ASH (Active Session History) keeps a per-second sample of active sessions in a circular buffer, usable after the fact to reconstruct exactly what each session was doing during the minute of the incident. The alert log records errors, locks, state transitions. The operating system retains CPU, memory, and I/O metrics. Storage retains latency patterns and queue depth. The change repository — if one exists, and there should always be one — records every configuration change, every application release, every infrastructure patch. Modern observability, discussed in another article in this series, retains time series spanning weeks or months.
Pulling these sources together seventy-two hours later requires method — but it produces a reconstruction that is more accurate, not less, than one done in the heat of the emergency. In the heat of the moment you search to stop the symptom. With time and distance you read to understand the chain. These are two distinct acts with different purposes; the second is made harder by the pressure of the first, not by the passage of time.
One case, and what happened three weeks later #
A banking context: a payment authorization service on Oracle in high availability, peak load around 1,400 transactions per second during commercial windows. On a Saturday afternoon, for forty-two minutes, the average service latency climbed from 180 ms to over 2 seconds, with a fraction of transactions timing out. Monitoring alerted, the on-call team connected, saw a dominant enqueue wait on a user session table. Before any countermeasure was decided, the curve came back down. In forty-two minutes the system was back within threshold.
The post-mortem was brief. The working hypothesis, formulated without strong evidence, was “an anomalous load pattern on Saturday afternoon, possibly related to a commercial campaign.” The team closed the ticket, the weekend resumed, Monday the system was holding. (Numbers — load, latencies, timings — are representative of similar contexts; specifics of this case have been anonymized for contractual confidentiality.)
Three weeks later, the same combination of events recurred — this time on a Thursday evening, in the middle of the operational window, with transaction volume twice that of the previous Saturday. The system did not recover on its own. The downtime lasted two hours and ten minutes. The board asked for a reconstruction.
At that point, with the urgency of the second incident, the analysis was finally done that should have been done calmly three weeks earlier. The AWR from Saturday had, across two consecutive snapshots, a clear shift in the execution plan of a critical query — the effect of an automatic statistics recalculation triggered when the table had crossed a certain growth threshold. ASH showed the sequence of sessions that had gone into wait on that query, with the waiter count rising progressively until it triggered escalation on an internal database resource. The change log showed that a new application release, four days before the Saturday incident, had introduced an additional call to that query every time a user opened a session — a call that became critical only when session-open concurrency exceeded a certain level.
All of this was already in the system on Saturday afternoon. The thread connecting table growth, statistics recalculation, plan change, new release, and increased concurrency was not inferable from the recorded symptoms. It was readable by anyone who had assembled the sources with a causal model in mind — even two weeks later. The difference was not in the data available. It was in the decision to look.
The TIA is a predictor, not an episode #
In preventive cardiology and neurology there’s a concept worth keeping in mind when thinking about incidents that resolve on their own. It’s called a TIA — Transient Ischemic Attack. It’s a neurological event that presents like a stroke — speech difficulties, weakness in a limb, blurred vision — and resolves spontaneously within minutes or hours, with no permanent damage. The patient who goes to the emergency room is discharged with normal test results and a recommendation to monitor blood pressure.
Anyone familiar with the numbers knows that a TIA is one of the strongest predictors of major stroke in the following ninety days. The literature indicates that roughly one in ten patients will have a clinical stroke in the three months following a TIA, and half of those within forty-eight hours — if the underlying mechanism is not reconstructed and prevention is not put in place. A TIA is not an isolated episode: it’s the system showing, in reversible form, how it will fail in non-reversible form if nobody addresses the cause. (Epidemiological reference numbers — TO BE VERIFIED against current ESO/AHA guidelines before public citation.)
An incident that resolves on its own has the same nature. The system has shown, in reversible form, a mechanism that — with the same unresolved cause — will manifest again. Not necessarily at the same point, not necessarily under the same load, not necessarily on a low-pressure Saturday afternoon. The second incident picks the worst moment with statistical precision: because the unresolved cause keeps working, and because operational load grows until it finds the right window.
The TIA and the self-resolving incident share a second characteristic, a more uncomfortable one. Both induce relief. The patient discharged from the emergency room with normal results thinks they dodged a bullet, not that they received a warning. The team watching the curve come back down thinks the system held, not that the system spoke. Relief is not a wrong reaction — it’s human, legitimate, necessary after hours of tension. The moment relief becomes a risk is when it closes the investigation window before the investigation has even been opened.
The questions that come before closing the ticket #
None of these questions are meant to convince anyone to turn every incident into a six-week project. All of them serve to decide whether a spontaneous recovery closes the case or opens it, before it gets closed by omission.
1. Has the cause that would explain both the onset and the spontaneous recovery been articulated, or are we only explaining the symptom? An incident that starts because “there was an anomalous load pattern” doesn’t explain the recovery: the anomalous load didn’t switch itself off in exactly forty-two minutes. If there’s no causal model that accounts for both endpoints of the interval, the investigation hasn’t closed — it’s just stopped asking questions.
2. Which sources still hold traces of the incident, and for how long? AWR, ASH, alert log, OS logs, storage metrics, change log, application telemetry. Each has a different retention. Mapping the residual investigation window before deciding whether to investigate costs thirty minutes and moves the decision from the emotional plane (“we’re exhausted right now”) to the operational one (“we have thirteen days”).
3. If the same mechanism recurred at twice the load, would the system still hold? This is the question an experienced cardiologist asks after a TIA. The system held once under favorable conditions — low commercial pressure, a quiet window, limited concurrency. The question is not “will it come back?” It’s “when it comes back, will it come back under conditions the system can still absorb?” If the answer is “we don’t know,” the episode is not a one-off: it’s a signal that hasn’t been read yet.
4. Who has the authority to call a cold reconstruction, and within what time window? Often the post-recovery investigation is never opened not by decision, but by absence of ownership. The operations team has moved to the next ticket, the architect has no explicit mandate, management has seen the system stable. Naming the owner of the cold reconstruction before the next incident is the most underrated — and cheapest — organizational intervention in the entire resilience governance stack.
The value of looking when the urgency has passed #
There’s a paradox worth making explicit, because it inverts a common intuition. Cold reconstruction is more accurate, not less, than hot reconstruction — when the sources have been preserved. In the heat of the moment you search with the anxiety of stopping the symptom, with the board asking for updates every ten minutes, with hypotheses piling on top of each other. With time and distance you read with the space to cross-reference different sources, verify correlations, discard leads that seemed relevant in the moment and turn out to be coincidences in retrospect.
Anyone who has done many post-recovery reconstructions also knows a second thing: the causal chain that emerges is almost never the one suspected on the afternoon of the incident. The “anomalous load pattern” hypothesis is plausible in the heat of the moment, when all that’s been seen is an anomalous curve. It becomes obviously incomplete with time and distance, when the change log from the previous week, the table growth, the statistics recalculation, and the new application release all enter the picture.
The organizational cost of a cold reconstruction — three to five days of expert time, with the system already stable and no urgency pressing — is a fraction of the cost of the second incident, measured in hours of downtime, board meetings, customer conversations, and SLA renegotiations. For a CFO, the comparison takes twenty seconds. When resistance exists, it’s rarely about budget: it’s about attention. An organization that has just exhaled a breath of relief is physiologically ill-disposed to turn that breath into a new cycle of analysis. This is precisely why, in many contexts, it helps to have the reconstruction called by someone outside the operational team — someone who didn’t live through the forty-two hours of tension and can suggest, calmly, that looking now costs less.
A question to carry with you #
There’s no universal rule about incidents that resolve on their own. There is, for every organization that manages critical ones, a question worth asking the next time the curve comes back down without intervention:
“Does the mechanism that explains how it started also explain how it ended — or are we only explaining the fact that it ended?”
If the answer carries any hesitation, the episode is not yet a one-off. It’s a system that spoke once. The second time, it will choose the moment when speaking costs more.
Glossary #
AWR — Automatic Workload Repository — Oracle Database’s built-in diagnostic tool for collecting and analyzing performance statistics.
ASH — Active Session History — Oracle component that records the state of every active session once per second, used for pinpoint performance diagnosis.
wait event — A diagnostic event recorded by Oracle whenever a session cannot proceed and must wait for a resource — I/O, lock, network or CPU.
piano di esecuzione — Sequence of operations chosen by the SQL optimizer to run a query: scans, joins, sorts. Stale statistics silently degrade it, regardless of hardware.