- Ivan Luminaria/
- Database Strategy/
- Technical Leadership & Projects/
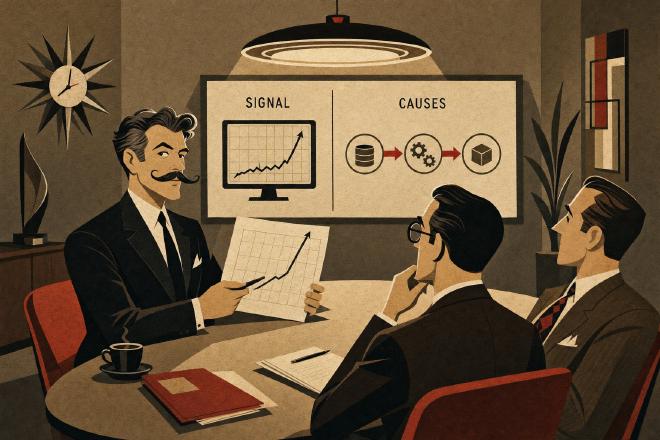
- AI shows the symptom. The board asks for the cause./
AI shows the symptom. The board asks for the cause.

AI shows the symptom. The board asks for the cause. #
What modern observability actually does — and what’s still needed when the question comes from upstairs.
The Monday morning question #
There’s a question every CIO knows well, and it almost always arrives within twenty-four hours of a serious incident. The board asks it, the CFO asks it, sometimes the CEO asks it in the hallway. It goes something like this, with minor variations: “didn’t we get Datadog last year? Didn’t we renew Dynatrace? Didn’t we activate Ops Insights on OCI? So how is it possible it didn’t warn us?”
The honest answer is uncomfortable, because it requires saying two things at once. First: the tool worked. The graph was there, the metrics were recorded, the alerts were configured. Second: the tool didn’t understand what was happening, because understanding wasn’t its job. Its job was to show. It showed — consistently, accurately. Nobody on the team read what it was showing as a signal of a chain that was forming.
Whoever presents the numbers to the board at that moment has two options. They can let the narrative become “the tool let us down” — and go back to procurement requesting another tool, perhaps more expensive, perhaps with more artificial intelligence claimed in the sales materials. Or they can take an afternoon to explain to the board what modern observability actually does and doesn’t do. The second path is harder, but it gives the CIO back control of the narrative — which is what the board is really looking for when they ask that question.
What a tool shows, what a person reconstructs #
Datadog, Dynatrace, Grafana, Splunk, New Relic, OCI Ops Insights, Oracle Cloud Observability are — each with its own genuine quality — extraordinary signal collectors. They record tens of thousands of metrics per second, correlate time series, apply statistical models that detect anomalies with a level of precision unthinkable ten years ago. In many scenarios the value they add is substantial: operational alerts that arrive before a predictable saturation point, dashboards that consolidate into a single view what previously required eight separate consoles, baselines that recognize a system’s normal behavior and flag when it deviates.
The point at which these tools stop substituting for a person isn’t a product quality limitation — it’s a structural limitation of the type of information they return. A graph shows that CPU spiked, that disk latency increased, that a wait event became dominant, that a query changed its execution plan. An AIOps model, in more sophisticated cases, signals that three or four of these phenomena are correlated in time. Correlation is not the causal chain. The causal chain is a story: a statistics package was recalculated on September 14th at 02:17 by the nightly job, the new execution plan for query X began full-scanning a table that had grown to 1.8 billion rows over the previous three months, contention on the enqueue application lock emerged when the new application release — deployed on the 16th — started calling that query every twenty seconds instead of every five minutes, the CPU spike that monitoring flagged on the 17th is the consequence of three events that monitoring never connected because nobody had asked it to look for this kind of story.
No tool tells this story. A person reconstructs it — someone who knows what to look for, because they’ve read thousands of similar chains, on similar systems, over ten or twenty years of practice. The tool provides the starting data. Without the tool, the reconstruction would be slower. Without the person, there would be no reconstruction.
A case, and the graph beside it #
An Italian telco context, Oracle on OCI, a critical analytical batch feeding a set of commercial dashboards. The observability was modern, the investment recent, AIOps active. For six consecutive weeks, the batch — which historically completed in two and a half hours — began running over: first toward four hours, then toward five. The tool flagged it consistently: anomaly on CPU wait, I/O read growth, increased storage latency on tier 1. Three distinct anomalies, correlated in time, none identified as the root cause — because none of them was.
The team spent three weeks chasing each anomaly individually. More CPU on the node, storage verification with the cloud provider, optimization of concurrent sessions. Each intervention produced an improvement of fifteen or twenty minutes on batch runtime, then the curve climbed again. None of the three interventions was wrong in itself: each addressed one of the anomalies the tool had flagged. None of them was the answer, because the answer wasn’t in any of the three anomalies taken individually.
A cross-layer analysis spanning five working days reconstructed the chain. An execution plan that had degraded three months earlier due to a statistic that had lost representativeness on a table that had grown by an order of magnitude; a PGA configuration change made in an urgent ticket in May and never documented; a new query introduced by a front-end application in early July, which opened unexpected contention on an internal lock structure in the database. Three events distant in time, documented in three different systems (the DBA repository, the infrastructure wiki, the application release manager), no automatic correlation possible between them for an observability tool — because they were events of different nature, period, and system.
The batch, after the joint revision of the plan, targeted indexing, and rollback of the PGA change, stabilized comfortably under thirty minutes. The observability tool, from that point on, became far more useful — because the team started reading its graphs with a map in mind. (The figures — 800 million records/day, SLA under 500 ms on the downstream service — are those declared in other engagements on comparable contexts; the operational detail of this specific case is anonymized for contractual confidentiality.)
The ECG is data, not a diagnosis #
There’s an image that helps, especially with a board that isn’t technical but has seen the inside of an emergency room at least once. An electrocardiogram records the heart’s rhythm with precision. It recognizes arrhythmias, flags ectopic beats, shows instantaneous frequency with a level of detail a doctor from fifty years ago would have considered science fiction. It’s an exceptional diagnostic instrument.
It doesn’t see a blocked carotid artery. It doesn’t see a clot forming in a deep vein. It doesn’t see an asymptomatic aneurysm. A patient can have a flawless ECG and suffer a stroke thirty seconds later. That’s not a defect of the ECG — it’s the nature of the ECG: it records one precise function, not all the patient’s functions. The doctor knows this, and uses the ECG as one of the tests, never as the diagnosis. Medical history, physical examination, other targeted tests based on clinical suspicion, the patient’s history over the years: all of these together reconstruct the picture.
A mission-critical system has the same nature as a complex patient. Modern observability is the ECG — exceptional at what it does, blind to what it doesn’t see. AIOps is an ECG that automatically highlights arrhythmias — useful. Diagnosis remains a human act, and it remains so not out of nostalgia for the past but because of the structure of the problem itself: the causal chain of a system layered over twenty years requires holding together DBA repositories, infrastructure change logs, application release notes, operating system traces, load patterns, data model changes. No tool today has simultaneous access to all these sources with the ability to read them together — and not because of limitations that will be resolved in the next eighteen months, but because of how the problem is structured.
The questions that precede trust in the tool #
None of these questions are meant to convince anyone to uninstall their observability stack — all of them serve to use it for what it is, with the right expectations from the board down to the operations team.
1. Does the tool see all the layers that make up the system, or only those where a collector was installed? Datadog APM covers instrumented applications magnificently; if a critical piece of the flow passes through a legacy service without an agent, the tool has a blind spot. That’s not a defect: it’s a perimeter decision that’s often forgotten after the first six months of use.
2. Who on the team interprets the alerts — and based on what mental model of the system? An alert that says “anomalous CPU wait on node 2” means different things to a sysadmin, a DBA, and a developer. If there’s no internal convention on who interprets what, the tool generates noise, the team learns to ignore notifications, and the value disappears without anyone noticing.
3. When the tool flagged an anomaly that turned out to be a symptom of a deeper cause, did anyone write down what had happened? Organizational incident memory is often poorer than the tool’s memory. A post-mortem runbook that connects “alert X was actually a symptom of chain Y” is worth, in the medium term, more than a tier upgrade for the tool.
4. If the tool showed green metrics for six consecutive weeks, what would you check anyway? That’s the question an experienced family doctor would ask a patient whose tests are all normal but who’s been tired for too long. A system can have all green graphs and be preparing to collapse: a silent queue of sessions waiting on a lock structure, a table growing outside its model, a procedure that loops every first Monday of the month and resolves itself before the alert threshold. Green is good news, not a guarantee.
What the board is really asking #
The board’s question — “why didn’t the tool warn us?” — almost always conceals another question, one that’s harder to ask explicitly: “who, here, is reading the system as a whole, beyond their own piece?”. When the answer is “in any structured way, nobody”, the tool becomes the easiest thing to point to as insufficient. That’s understandable, and it’s also a good opening for a conversation — because the real answer isn’t “let’s get a smarter tool”, it’s “let’s make sure someone, with the time and the mandate, is reading the tools we already have with the full picture in mind”.
That someone can be internal — a senior person with the right perimeter, shielded from operational noise, with the authority to speak to the board when needed. They can be supported from the outside on a continuous basis, as an independent perspective. In some moments — a post-incident reconstruction, a doubt about a platform estimate — they can be brought in from outside in a targeted way, with a precise and bounded mandate. None of these three paths requires replacing the observability tool: all three finally make it useful for what it is, a diagnostic ally that needs a skilled reader.
A question to take away #
There’s no universal principle about observability. There is, for every organization that has a mature one, a question worth asking at the next post-mortem:
“The tool showed in real time what happened — and in the two preceding weeks, had anyone been reading those graphs with a causal model in mind, or was everyone looking at their own piece?”
If the answer has any hesitation, the next time the board asks “didn’t we get Datadog?”, the conversation will be simpler to have — because the answer won’t be about the vendor, but about what we’ve learned to read in the meantime.
Ivan Luminaria is a Technical Leader for mission-critical databases. He works with CIOs, CTOs, and IT Directors at mid-tier banks, insurance companies, telcos, utilities, and large Italian public sector organizations, using a cross-layer reading method built over nearly thirty years of real-world systems.